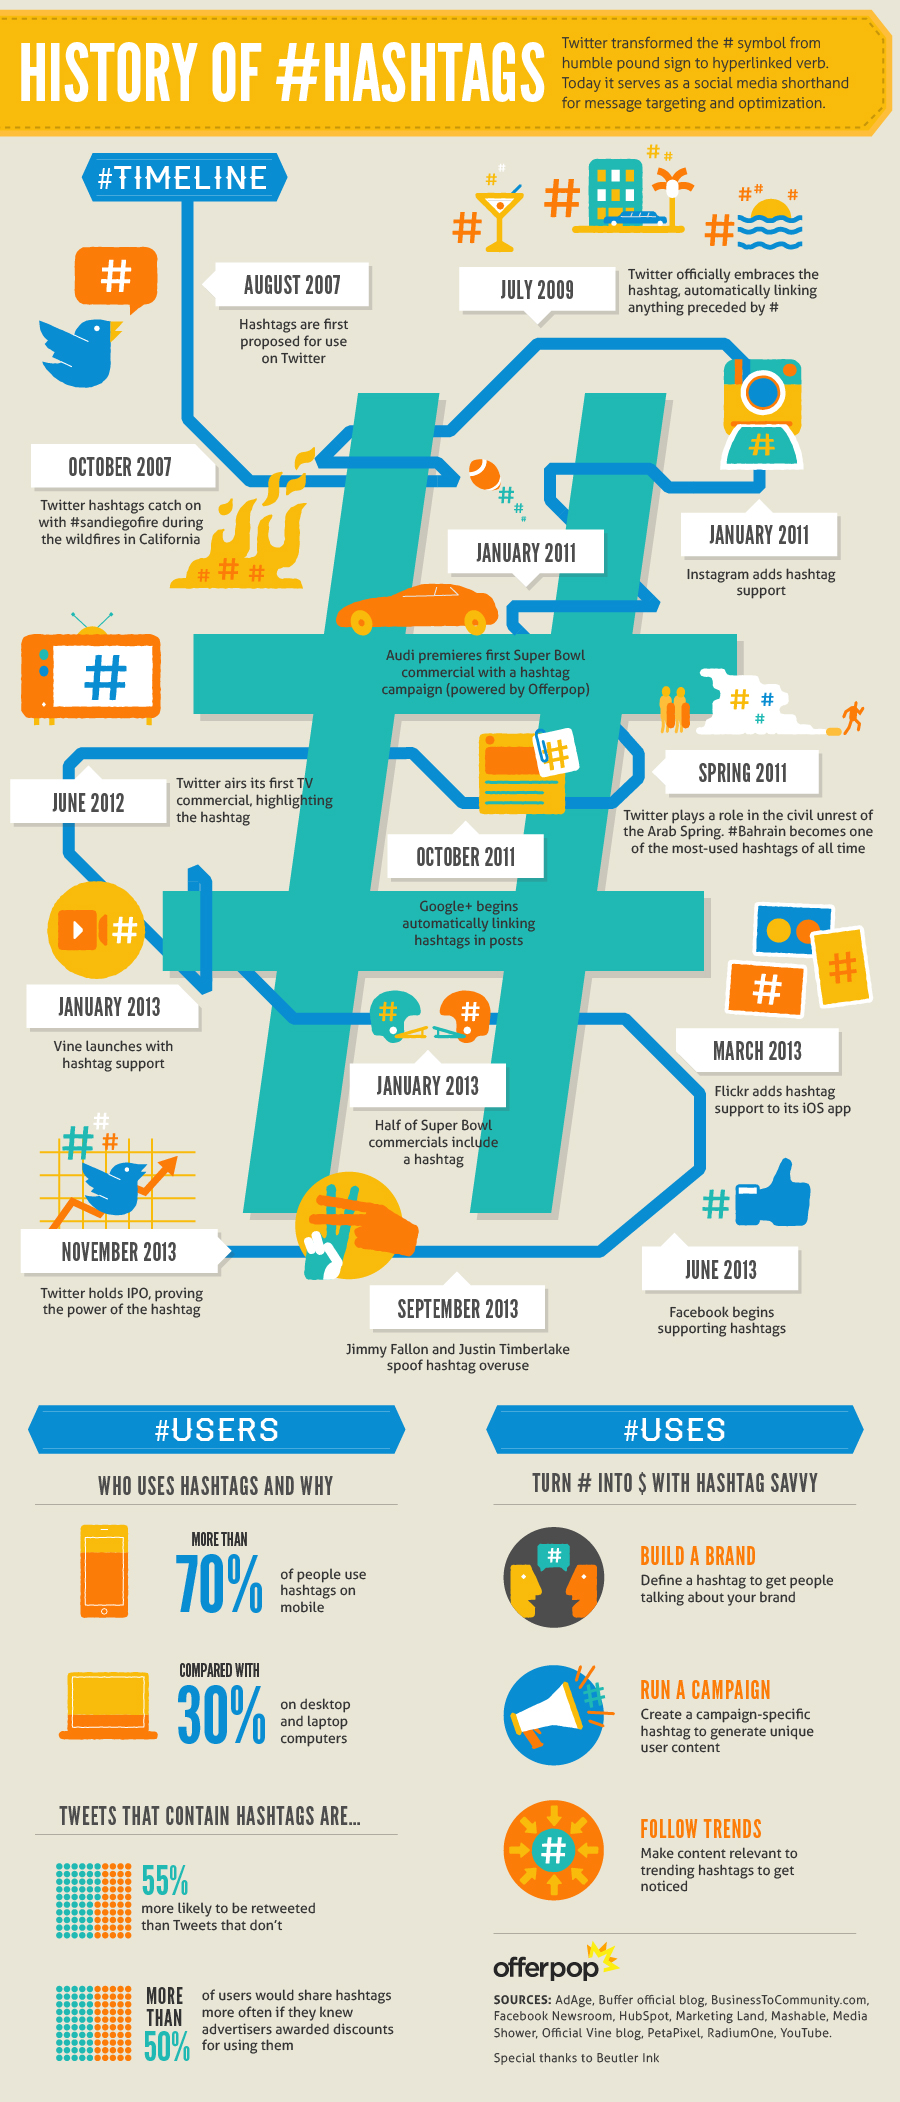
The History of Hashtags (INFOGRAPHIC)

Hashtags have come a long way since they were first used on Twitter six years ago. From an unofficial way of giving context to a tweet, to a feature used by Facebook, Google+, Instagram, Flickr and more, the humble # sign is now a vital feature of social media marketing.

Offerpop have created an infographic all about the hashtag and its usage by individuals and businesses on various social media platforms.

Beutler_Offerpop_Hashtag_Design-final-2

Facebook Keyboard Shortcuts Cheat Sheet

As somebody who sometimes uses speech recognition software, keyboard shortcuts are an important part of my life! Even when I’m not using SRS, I still frequently choose to use my keyboard rather than my mouse to make my way through my Gmail messages and Google Reader, amongst other things.

It had never occurred to me that Facebook might have a set of keyboard shortcuts available, so once I found this infographic from mycleveragency, I just had to share it.

Facebook Cheat Sheet by mycleveragency
Facebook Shortcuts Cheat Sheet is an infographic that was produced by mycleveragency


The B2B Social Network: Get the Best Out of LinkedIn (Infographic)

LinkedIn is unusual amongst social networking websites in that it is primarily focused on careers and B2B networking. We discussed some of its idiosyncrasies in the latest episode of the A Little Bird Told Me podcast and we will continue the discussion in episode 3 (subscribe here to make sure you don’t miss it).

Power Formula have created the following infographic about LinkedIn usage, and it contains some really useful information about how to get the best out of the site.

Connect with me on LinkedIn here.

Linkedin Infographic
Via: PowerFormula for Linkedin Success


Facebook, Twitter, Google+ And Pinterest – Complete Social Media Sizing Cheat Sheet [INFOGRAPHIC]

**Actual people, ignore this line, it’s a technorati claim code! : EJXAM8HYKW7K **

Designed by LunaMetrics, who also provided the following plain-text information:

Facebook Image Sizes

  • Cover Photo
    • 851 x 315 pixels
  • Profile Picture
    • 160 x 160 pixes
      • Must be uploaded sized at least 180 x 180 pixels
  • Distance between left boundary and profile picture
    • 23 pixels
  • Distance between top boundary and profile picture
    • 210 pixels
  • Profile Picture border size
    • 5 pixels
  • App Preview Image
    • 111 x 74 pixels
  • Distance between App preview images
    • 8 pixels
  • Total length of adjustable app preview images, with gaps
    • 349 pixels
  • Shared Image size on Timeline
    • 403 x 403 pixels
      • Up to 960 x 720 pixels in lightbox, can be uploaded up to 2048 pixels
  • Status Update
    • 63,206 characters
  • Link Preview
    • 90 x 90 pixels
      • Both Title Tag and Meta Description can be edited by clicking on the preview text
  • Highlighted Post/Milestone
    • 843 x 403 pixels
  • Profile Picture In Stream
    • 50 x 50 pixels
  • Shared Image In Stream
    • 398 x 298 pixels
  • Profile Picture on Facebook Sponsored Story Ads
    • 32 x 32 pixels
  • Sponsored Story Body Copy
    • 90 Characters
  • Sponsored Story Image Size
    • 194 x 139 pixels
  • Album Image Preview type 1
    • 129 x 129 pixels
      • Can show either 6 or 9 photos at this size
  • Album Image Preview type 2
    • 398 x 264 pixels
      • Three 129 x 129 pixel boxes underneath
  • Album Image Sizing type 3
    • 196 x 196 pixels
      • Two preview images
  • Facebook Ad Image Size
    • 100 x 72 pixels
  • Facebook Ad Title Copy
    • 25 characters
  • Facebook Ad Body Copy
    • 90 characters
  • Shared YouTube Video Preview
    • 130 x 73 pixels
  • Shared Facebook Video preview
    • 398 x 223 pixels

Twitter Image Sizes

  • Profile Picture
    • 128 x 128 pixels
      • Must be <700kb when uploaded, resized to 48 x 48 pixels in stream
  • Brand Banner
    • 835 x 90 pixels
      • Only available to select Twitter partners
  • Tweet Length
    • 140 Characters
  • Background Sizing (Visible space between left side and content)
    • 90% see 71 pixels
    • 65% see 199 pixels
    • 40% see 242 pixels
    • 20% see 279 pixes

Google+ Image Sizes

  • Cover Photo
    • 940 x 180 pixels
      • Can be animated using a .gif
  • Profile Picture
    • 250 x 250 pixels
  • Profile Picture border size
    • 5 pixels
  • Ribbon Photo
    • 5 x 110 pixels each
      • Can be animated using .gif’s
  • Profile Picture In Stream
    • 48 x 48 pixels
  • Shared Images
    • 497 x 373 pixels
      • Up to 2048 pixels in lightbox
  • Post length
    • 100,000+ characters
      • Cannot edit link Title Tags or Meta Descriptions

Pinterest Image Sizes

  • Profile Picture
    • 49 x49 pixels
      • Resized from 160 x 160 pixel profile picture
  • Pinned Images
    • 600 x Infinite pixels
  • Pin Description Length
    • 500 Characters
      • Can include hyperlinks

The Science of Social Media Timing (infographics)

The more involved a person gets in social media, the more they will aim to work out the optimal times to transmit their messages. This is particularly true for those using it as a promotional tool, but anybody who enjoys a lot of engagement and many retweets and ‘likes’ will have noticed that there are certain times of the day or week when their followers are more likely to click their links and share them with their own followers.

The increase in popularity of services such as BufferApp is additional proof that people are aware of the power of timing in their social media posting. Using this service, a person can add tweets to be sent to their Buffer, and Buffer will spread them out and post them with strategic timing.

Dan Zarrella is a ‘social media scientist’, and while that might sound like one of those meaningless new job titles, it is one that he actually merits. His studies into the very specific factors which make a tweet retweetable, or a pin repinnable, are mind-blowing, not least in their detail. KISSmetrics got hold of some data by Dan, from a webinar he ran and turned it into three fascinating infographics.

It is worth noting that they are somewhat US-centric, as indeed is much of the web. Not only that, but while the information is incredibly well-researched and valuable, it should mainly be used to give you an idea of where to start with your own social media marketing, rather than as a set-in-stone blueprint. There is no substitute for observing and testing your own results and altering your social media promotions based on those observations – your target audience may well have different characteristics, and getting to know, and fully understand, those is what you need to do for the ultimate results in your own social media marketing.

However, that said, a lot can be learned from the following infographics, so use them as a springboard for streamlining your own social media, email marketing and blogging promotional efforts.

If you are looking for blog posts, web content or eBooks or in-depth reports about social media, hire me as your social media writer.